


CAGR Calculator
Calculate compound annual growth rate for an investment.
A CAGR calculator is a tool used to measure the average annual growth rate over a period, assuming growth occurs at a steady, compound rate. People use a CAGR calculator because it turns messy, uneven growth into a single, easy-to-understand annual rate, making comparison and decision-making much simpler.
CAGR Calculator
Enter the required values and run the tool to view results.
Recommended Next Checks
Continue the same task with related tools. When possible, your current input is carried to the next page.

Savings Calculator
Savings Calculator estimates how much money you’ll save over time with regular deposits an...

APY to APR Calculator
Convert APY to APR with a simple interest-rate calculation.

BMR Calculator
Estimate basal metabolic rate and daily calorie needs.

Energy Calculator
Energy Calculator estimates your daily energy needs and calorie requirements.
How to use CAGR Calculator
Use CAGR Calculator when you need a fast, browser-friendly way to calculate calculator values. Enter the required value, review any validation hints, and run the tool to get a clear result that can be copied, downloaded, or used in your next workflow.
This Calculator Tools utility is designed for repeatable checks and everyday troubleshooting. For best results, use complete and accurate input, review the output carefully, and combine the result with related tools when you need a broader diagnosis.
When this tool is useful
- Checking a value before publishing, deploying, or sharing it.
- Saving time on routine calculator tools tasks.
- Comparing results with related IPLocation.net tools for a more complete review.
- Documenting a result for technical support, SEO work, security review, or development notes.
CAGR Calculator tips
Keep a copy of the original input when comparing results, especially for DNS, web, image, PDF, text, and code tools. If a result depends on live network data, remember that DNS records, HTTP headers, certificates, rankings, and third-party responses can change over time.
What is CAGR Calculator?
A CAGR calculator helps you measure growth as if it happened at one steady annual rate even when real-life performance is messy. If an investment zig-zags (up big one year, down the next), CAGR gives you one “smoothed” annualized number that’s easier to compare across options.
What is CAGR?
CAGR stands for Compound Annual Growth Rate. It represents the mean annual growth rate of something (an investment, revenue, users, home prices, etc.) over a period longer than one year, assuming the value compounds. It’s widely used because it turns uneven performance into a single comparable rate.
Why use a CAGR calculator?
- To compare apples-to-apples: Different investments over different time ranges are easier to compare using annualized growth.
- To translate “total growth” into “per-year”: “Up 80% in 5 years” becomes a more intuitive annualized rate.
- To reduce confusion from volatile years: CAGR offers one consistent rate for uneven yearly returns.
- To sanity-check plans: If your goal requires an unrealistic CAGR, your plan (or timeline) might need adjustment.
- To explain performance clearly: Many reports use CAGR because it communicates trend strength in one number.
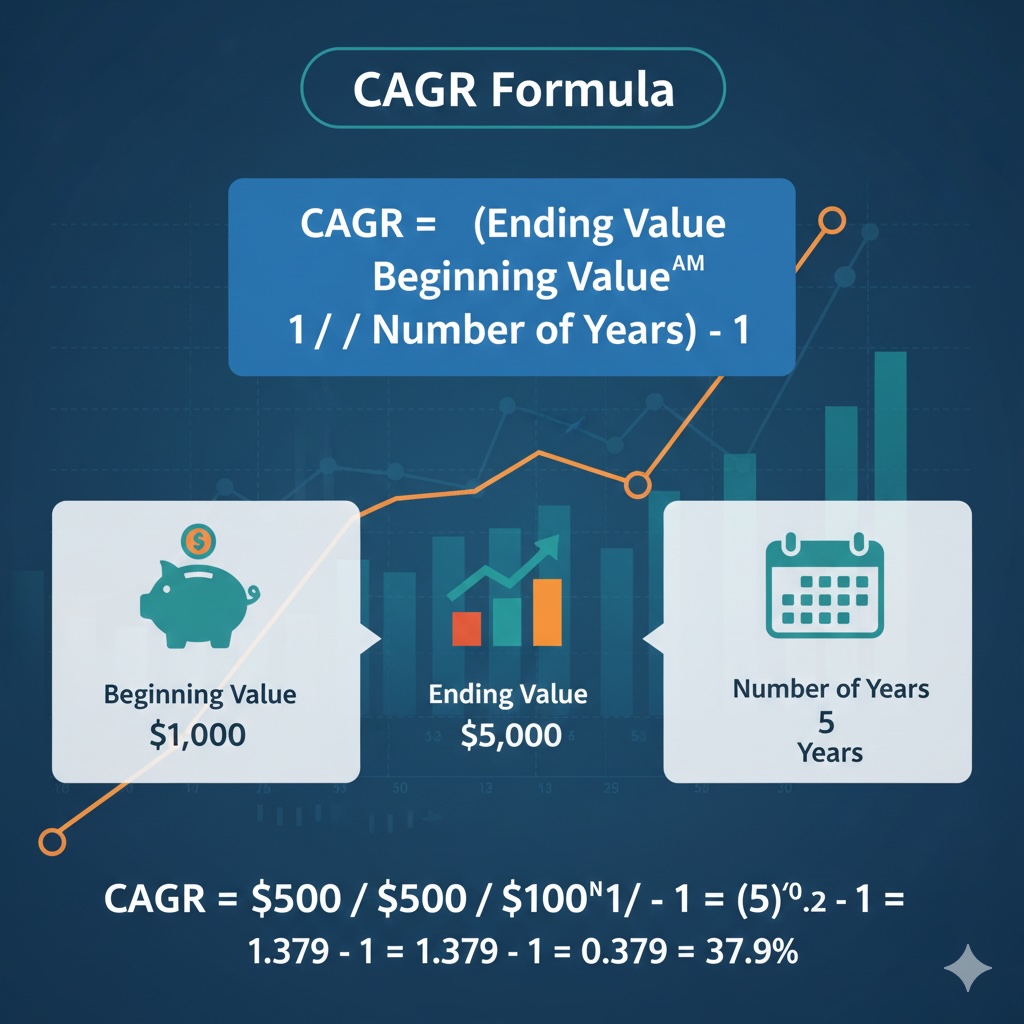
How CAGR is calculated
You only need three inputs:
- Beginning value (BV)
- Ending value (EV)
- Number of years (n)
Graphical formula (easy copy/paste style):
Worked example
Suppose you invest $10,000 and it grows to $18,000 over 5 years. Your CAGR is:
CAGR vs. Simple Average Return
These two sound similar, but they answer different questions. The simple average return is the arithmetic mean of periodic returns. CAGR is the geometric growth rate that matches the actual start-to-finish compounding.
| Metric | What it means | Best for | Common pitfall |
|---|---|---|---|
| Simple Average Return | Add the yearly % returns and divide by the number of years (arithmetic mean). | Quick “typical year” snapshot when volatility is low. | Can be misleading when returns swing a lot (doesn’t represent compounding well). [oai_citation:6‡Investopedia](https://www.investopedia.com/investing/compound-annual-growth-rate-what-you-should-know/?utm_source=chatgpt.com) |
| CAGR | One steady annual rate that would turn BV into EV over n years (geometric mean). | Long-term comparisons and “how fast did it grow overall?” | Smooths the path and can hide drawdowns/volatility if you only look at the final CAGR. [oai_citation:7‡Investopedia](https://www.investopedia.com/investing/compound-annual-growth-rate-what-you-should-know/?utm_source=chatgpt.com) |
Mini-example showing why CAGR can differ from average
If an asset goes +50% one year and -33.33% the next, the simple average return is (50% - 33.33%) / 2 = 8.33%. But the value ends exactly where it started: 1.0 × 1.5 × 0.6667 = 1.0, so the CAGR is 0%. This is why investors like CAGR for “true” compounded outcomes.
Practical uses of a CAGR tool
- Investing: compare funds, portfolios, and asset classes over the same timeframe.
- Business: measure revenue growth, user growth, churn reduction (as a growth rate), or market expansion.
- Personal finance: compare “should I invest vs pay down debt vs save?” using expected annualized outcomes.
- Real estate: estimate how fast prices rose (not including rent, taxes, or maintenance).
- Forecasting: back into what CAGR is required to hit a goal by a certain date.
Real-world CAGR examples
The examples below are educational. Historical returns do not guarantee future results, and “CAGR” ignores many real-world factors (taxes, fees, inflation, cash flows, and risk).
Example 1. Historical S&P 500 performance (illustrative CAGR)
One long-run dataset shows that an S&P 500 investment (with dividends reinvested) from 1957 through 2026 equates to about 10.61% per year nominal, and about 6.76% per year inflation-adjusted (real).
Tip: This is exactly the kind of question a CAGR calculator answers well—“what constant annual rate would turn my starting amount into the ending amount over this time?”
Example 2. Real Estate price growth (Case-Shiller Home Price Index)
Using the S&P CoreLogic Case-Shiller U.S. National Home Price Index as an example: the index is about 63.732 at the start of 1987 and about 328.149 in late 2025.
If you convert that change into a single annualized rate (CAGR), it’s roughly ~4.3% per year over that multi-decade span (price index only—this does not include rental income, taxes, insurance, or maintenance).
Example 3. Savings account returns (rate-based CAGR)
Savings accounts are often quoted as an annual rate. If the APY stayed constant and interest compounded, the “CAGR-like” growth rate is approximately the APY (because it’s already annualized).
For context, the U.S. national average savings rate is listed around 0.39% in January 2026 (FDIC via FRED). At that rate, a savings balance grows slowly compared with risk assets, but it typically offers stability and liquidity.
Related Tools
Savings Calculator
Savings Calculator estimates how much money you’ll save over time with regular deposits and interest growth.
APY to APR Calculator
Convert APY to APR with a simple interest-rate calculation.
BMR Calculator
Estimate basal metabolic rate and daily calorie needs.
Energy Calculator
Energy Calculator estimates your daily energy needs and calorie requirements.

Dividend Calculator
Estimate dividend income from stock value, yield, and payment frequency.
Stock Average Calculator
Stock Average Calculator helps calculate the average share price.
Suggest an improvement
Tell us if something is confusing, broken, incorrect, or missing. Feedback helps us improve the tools and workflows people use every day.